Power Query Automated ETL Pipeline
This project transformed a highly fragmented, messy dataset from multiple ad platforms into a standardized, fully automated data pipeline for the De-Estybee Ecom Store.
The Workflow Evolution
Before
- Traffic sources were split across 12 overlapping, messy variations.
- Date columns contained a chaotic mix of US, UK/Global, ISO, and text-month formats causing constant errors.
- Financial columns were unusable due to a mix of numeric values, text strings, and currency symbols.
- Duplicate transactions created inflated, unreliable revenue totals.
After
- Power Query automatically consolidated the 12 sources into four clean categories.
- 100% of date rows dynamically evaluated and converted into a unified standard.
- Spend and revenue data programmatically stripped of text and rounded for exact financial accuracy.
- The reporting process became a 1-click refreshable pipeline instead of a manual rebuild.
The Challenge
De-Estybee Ecom Store handed over a highly fragmented and messy dataset sourced from multiple advertising platforms.
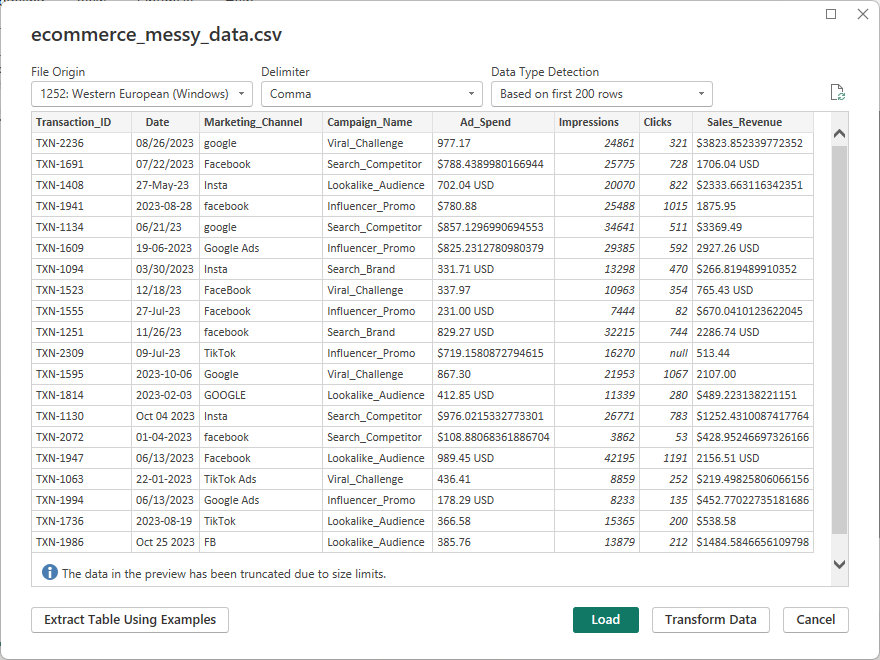
The objective wasn't just to clean the data for a one-off report, but to build a standardized, automated workflow.
The stakeholders had 5 strict requirements:
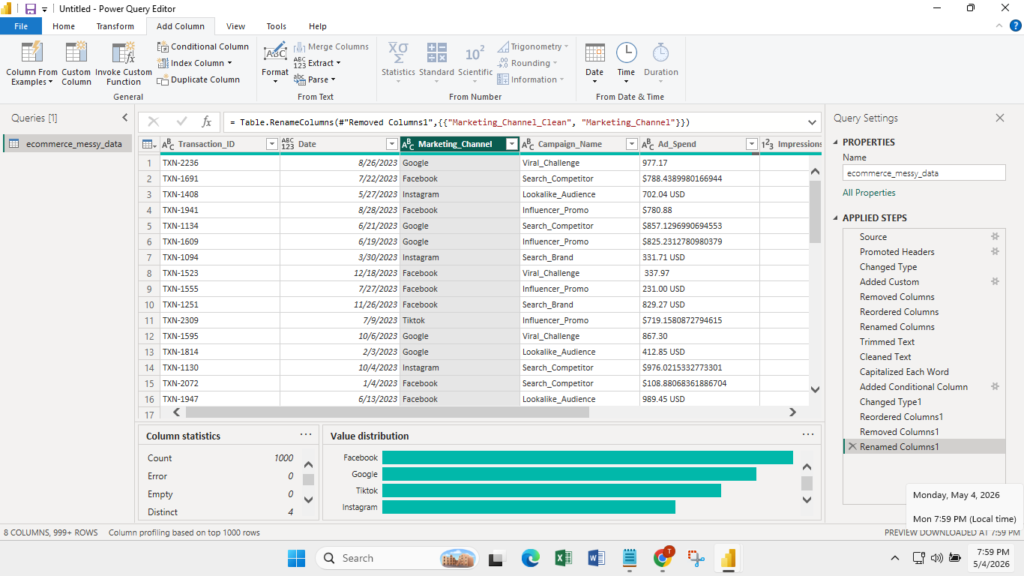
- Standardized Channels: Consolidate 12 overlapping traffic sources into four clean categories (Facebook, Google, Instagram, TikTok).
- Clean Numbers: Strip out all text, symbols ($, USD), and formatting errors from financial columns to allow for accurate aggregation.
- Real Dates: Convert conflicting global date formats into a single, workable standard for month-over-month grouping.
- No Duplicates: Ensure absolute accuracy by removing duplicate transactions via unique TXN IDs.
- Calculated ROI: Engineer a custom metric to track Return on Ad Spend (ROAS) using the formula
(Sales_Revenue - Ad_Spend) / Ad_Spend.
How I Cleaned and Automated a Messy Ecommerce Reporting Workflow
To ensure the client never had to clean this data manually again, I bypassed Excel and built a fully automated, refreshable data pipeline using Power Query.
Here is how I tackled the core issues:
1. Taming the Date Collision
The source data featured a chaotic mix of US (01/15/2023), UK/Global (17-01-2023), standard ISO (2023-01-16), and text-month (Jan 19 2023) date formats living in the exact same column.
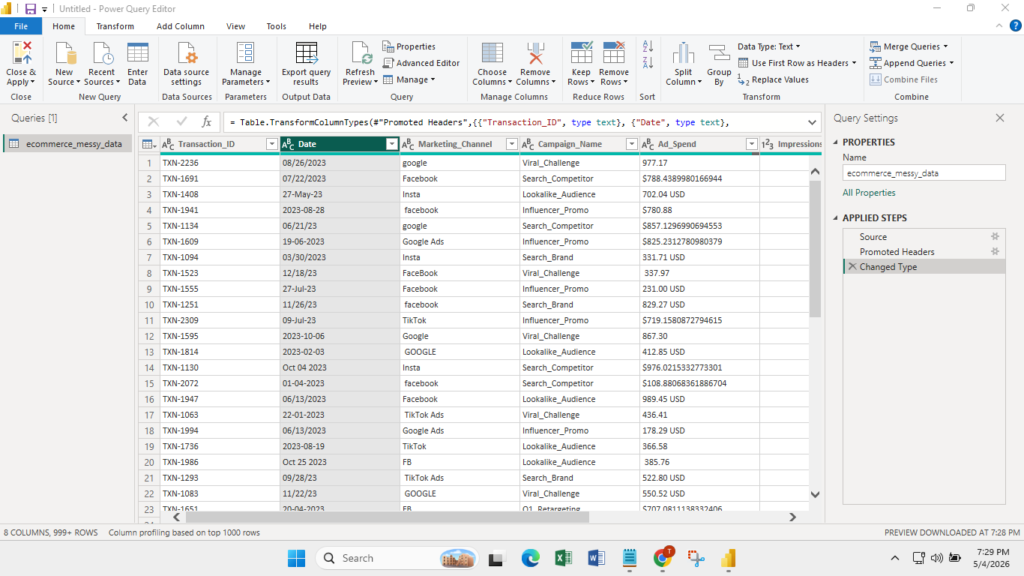
Standard conversion tools instantly returned errors.
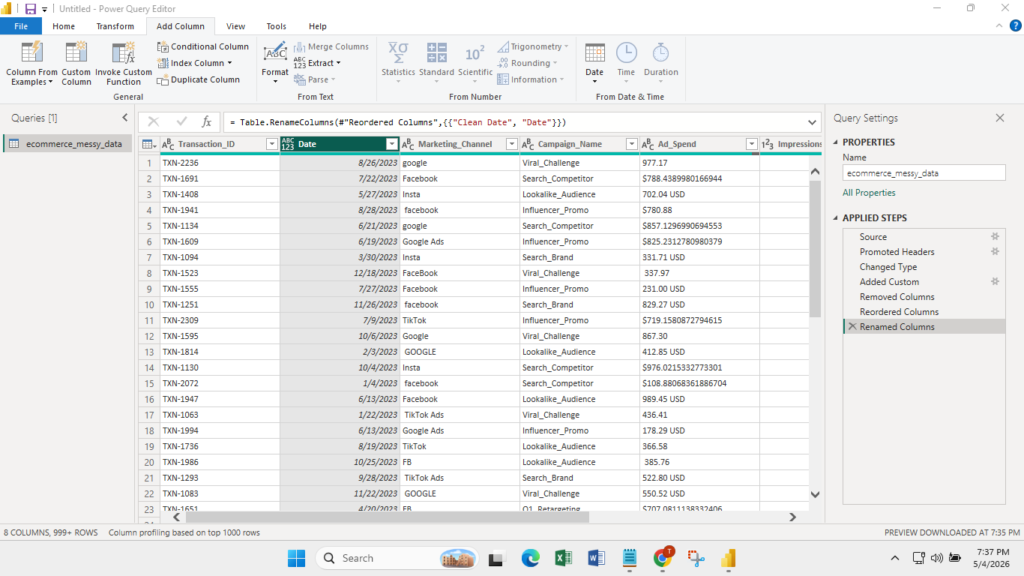
To fix this, I wrote custom M code using the Date.From function to dynamically evaluate and parse each row, successfully converting 100% of the rows into a clean, unified Date format.
2. Channel Consolidation (1-Click Grouping)
Before grouping, I trimmed all invisible spaces and converted the text to Proper Case to prevent matching errors.
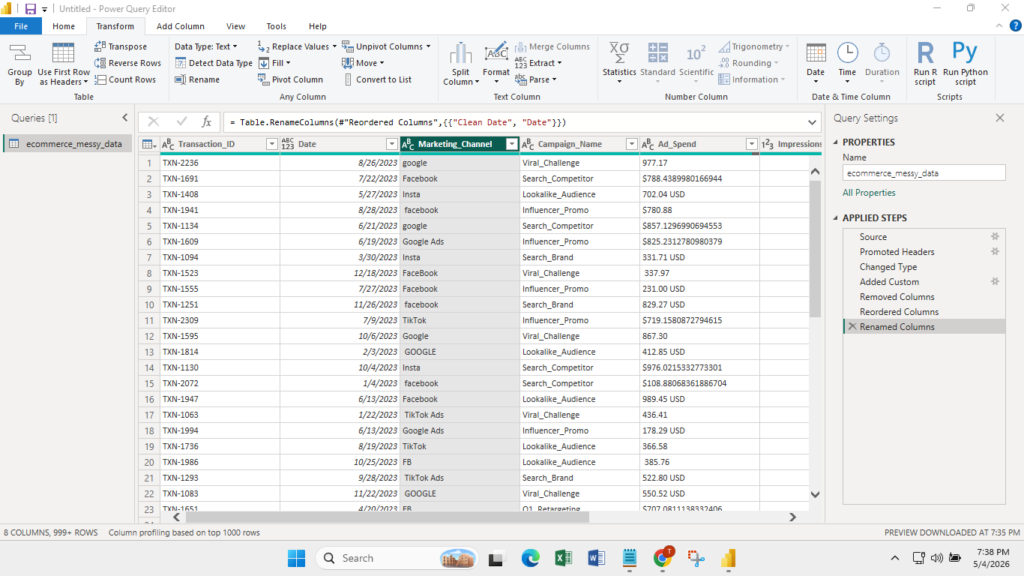
A quick data profile revealed 12 messy variations of marketing channels.
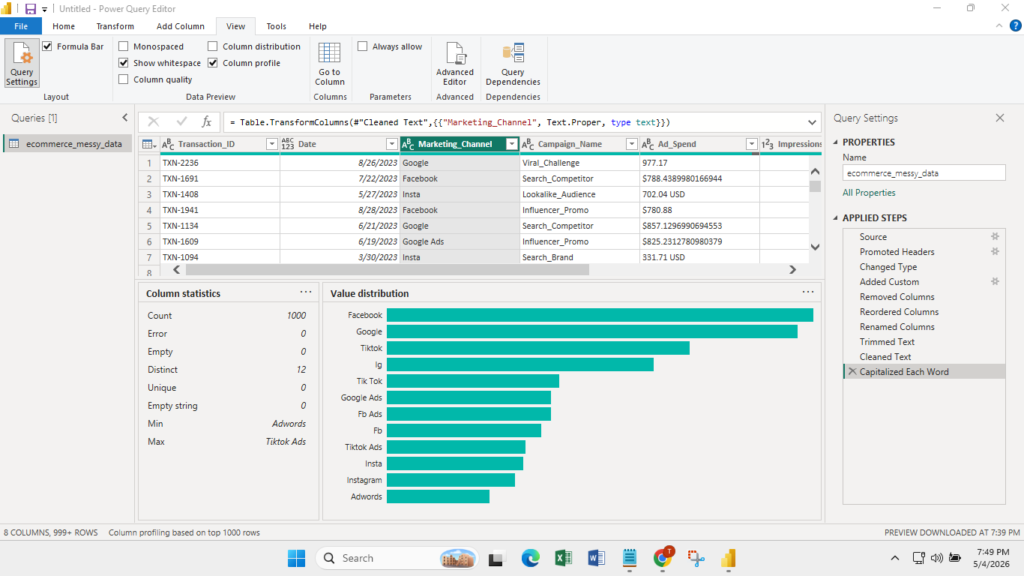
Instead of manually mapping each variation, I built a highly efficient conditional logic column.
For example, IF the channel started with "F", it was routed to "Facebook". But for specific outliers like AdWords, I used an EXACT match logic.
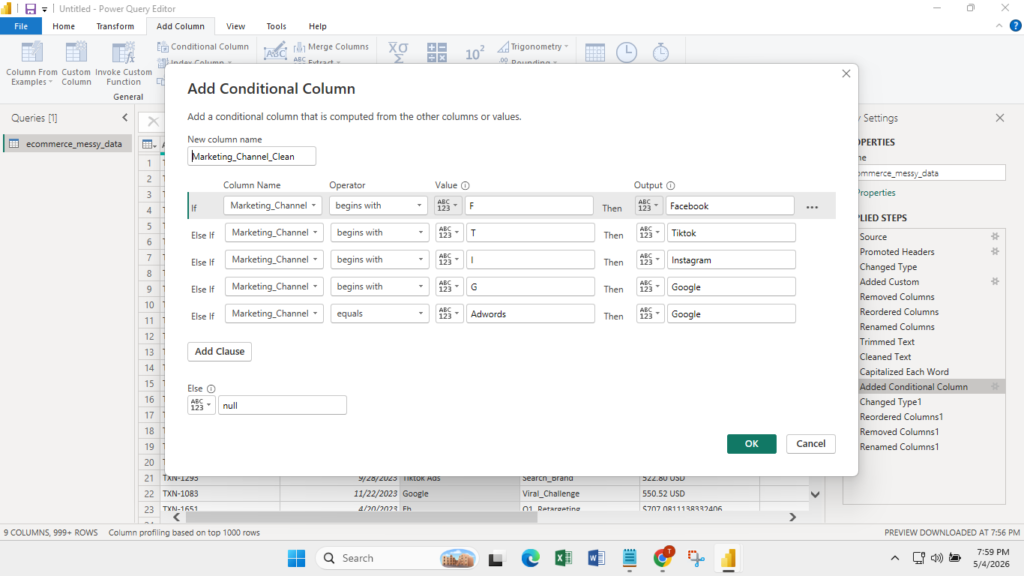
This instantly consolidated the messy data into the four requested categories.
3. Financial Data Extraction & Formatting
The "Ad Spend" and "Sales Revenue" columns were unusable due to a mix of numeric values, text strings, and currency symbols.
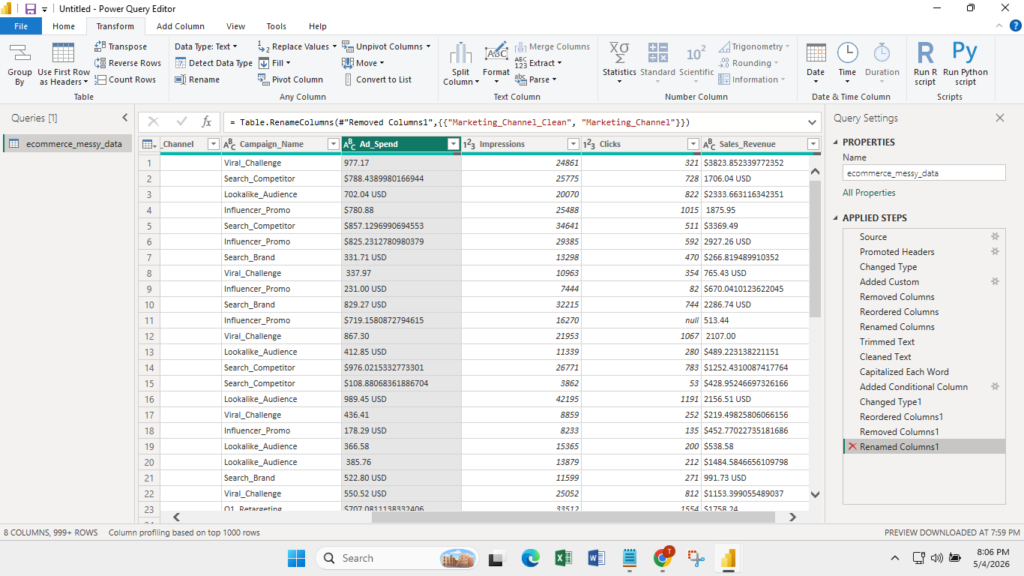
I resolved this data-type mismatch by deploying a simple but highly effective Text.Select logic.
This script programmatically isolated only the numeric characters.
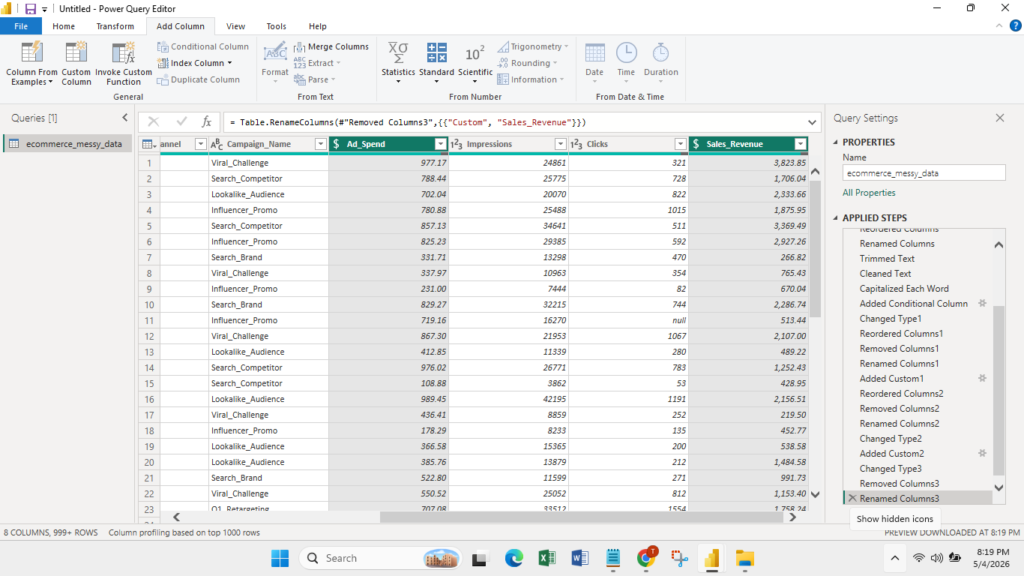
To guarantee financial reporting accuracy, I implemented a strict rounding protocol, formatting all spend and revenue data to exactly two decimal places.
4. Deduplication
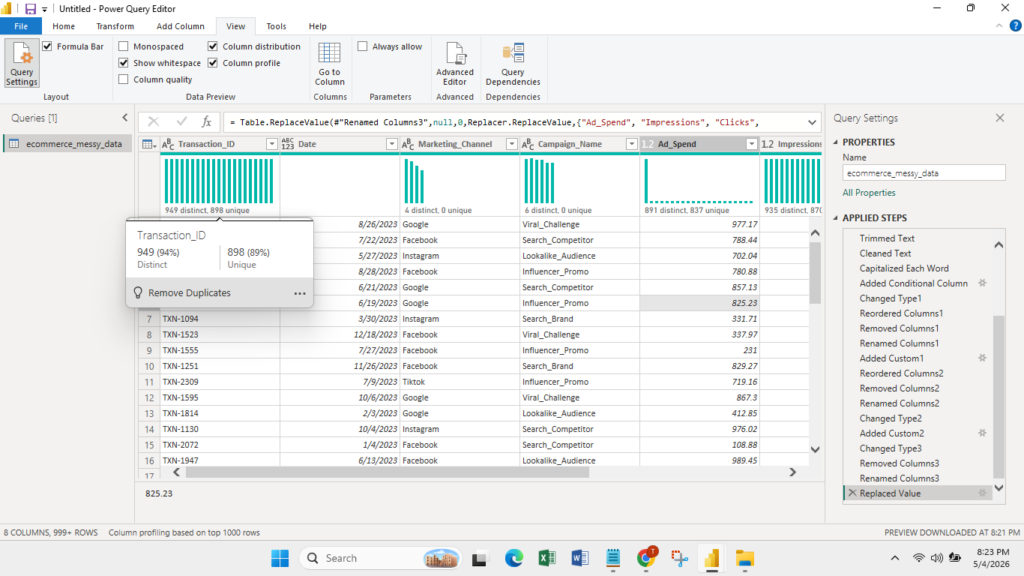
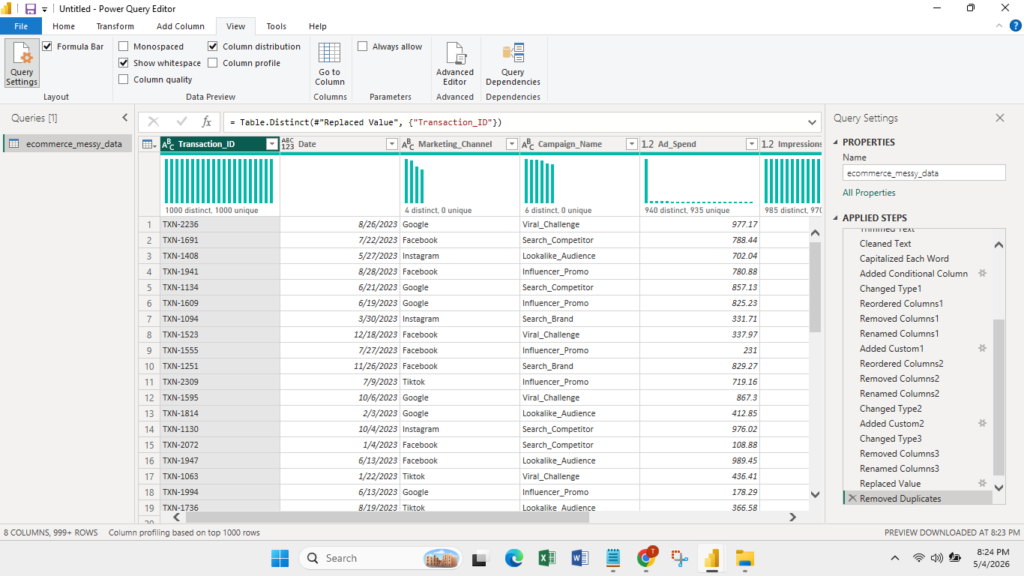
To ensure we weren't double-counting revenue, I targeted the TXN ID column, removing all duplicates so that each row represented a single, unique transaction.
5. Over-Delivering on ROI Logic
The stakeholder requested a standard ROAS calculation, but I took it a step further to make the dashboard actionable.
I created a custom conditional column that calculated ROI and included specific error handling to replace all null values with 0.
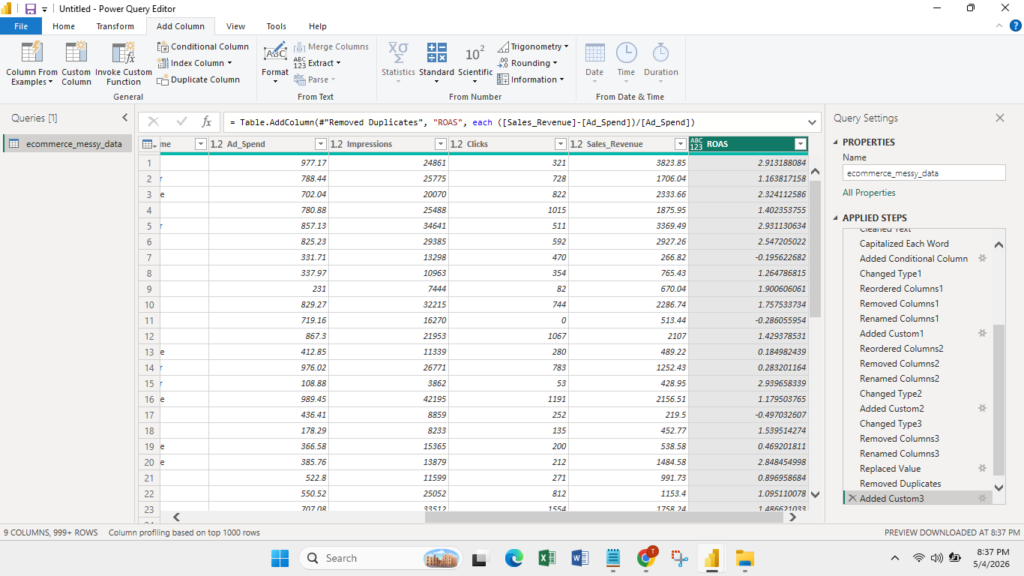
If Sales Revenue was 0 but Ad Spend was active, the system automatically returned -100%.
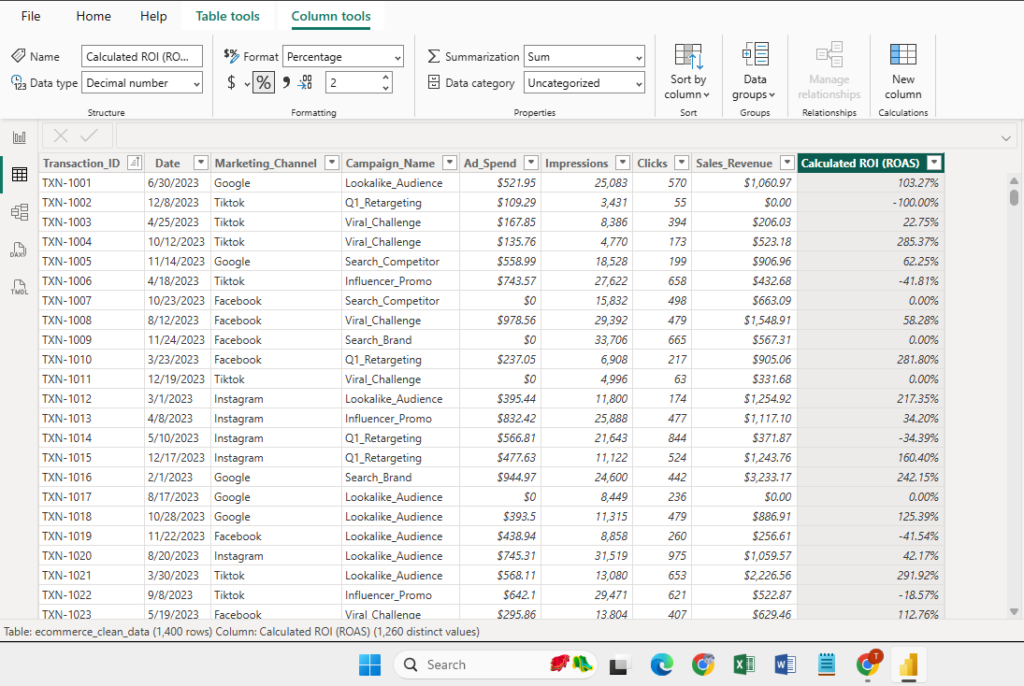
When visualized in Power BI, this serves as an immediate red flag for stakeholders, highlighting underperforming campaigns that need to be paused immediately.
(Note: This logic bypassed Search campaigns, where zero spend with positive revenue is an expected organic outcome).
The Results & Data Insights
With the data successfully cleaned and modeled, I generated the final executive reporting tables and dashboard.
Dashboard
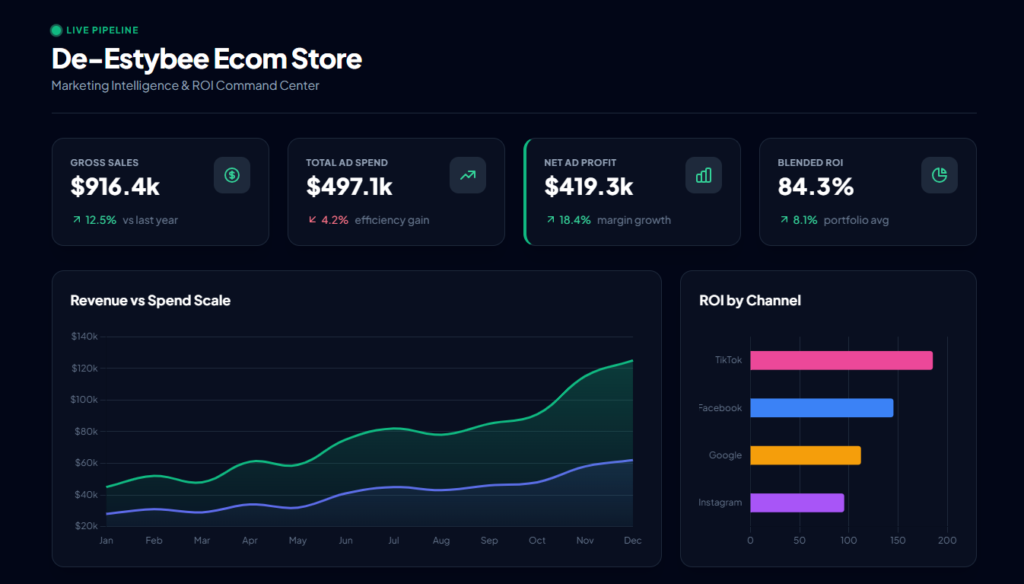
Monthly Spend vs. Revenue
| Month | Ad Spend ($) | Sales Revenue ($) |
|---|---|---|
| January 2023 | 49,018.75 | 109,626.53 |
| February 2023 | 55,606.06 | 124,934.05 |
| March 2023 | 45,675.34 | 102,699.73 |
| April 2023 | 69,242.54 | 148,039.97 |
| May 2023 | 66,987.69 | 139,657.07 |
| June 2023 | 70,272.12 | 170,214.50 |
| July 2023 | 54,980.25 | 124,906.28 |
| August 2023 | 65,427.79 | 131,487.22 |
| September 2023 | 51,958.64 | 120,612.68 |
| October 2023 | 69,948.46 | 156,803.45 |
| November 2023 | 53,718.00 | 121,543.10 |
| December 2023 | 63,194.52 | 134,540.91 |
| January 2024 | 5,773.34 | 12,928.59 |
Performance Summary by Channel
Facebook emerged as the top-performing channel by sheer volume, while TikTok and Facebook tied for the highest average ROI per transaction.
| Channel | Total Spend ($) | Total Revenue ($) | Average ROI |
|---|---|---|---|
| 207,058.10 | 474,403.72 | 109.73% | |
| TikTok | 152,745.90 | 358,605.15 | 106.91% |
| 158,987.99 | 344,867.49 | 105.78% | |
| 203,011.51 | 420,117.72 | 98.10% |
Key Business Takeaways
- Top Performing Campaign: The Search_Competitor campaign on TikTok drove an impressive aggregate ROI of 166.46% (generating $62,659.49 in revenue from just $23,515.79 in spend).
- Peak Revenue: June 2023 marked the highest monthly revenue at $170,214.50, coinciding perfectly with the highest monthly ROI (142.22%).
- Spend Efficiency & Stability: Throughout 2023, the monthly ROI consistently held above 100%. More importantly, when the client scaled their budget in June and October, ROI remained highly profitable, proving that the business can confidently scale ad spend without hitting immediate diminishing returns.
What a Business Owner Gains
A business owner implementing this pipeline gains:
- Less time wasted on manual spreadsheet cleanup.
- More reliable reporting, with totals free of double-counted rows.
- Clearer visibility into channel-level performance and ROAS.
- A repeatable system for future monthly reporting.
- A stronger, error-free base for dashboard and budget analysis.
Note on Data Privacy: To protect proprietary business intelligence, all transaction IDs and specific date stamps in this case study have been anonymized or generated as synthetic data. The underlying mathematical logic and Power Query cleaning workflows remain identical to the original production environment.