SQL Business Questions Analysis
How I used SQL to answer core commercial questions from raw marketing and sales data, uncovering true financial ROAS for a growing DTC brand.
The Workflow Evolution
Before
- Meta and Google Ads claimed high ROI, but actual internal profit margins were shrinking.
- Ad spend and actual sales data lived in isolated silos, forcing manual Excel merges.
- Quarterly budgets were planned using platform-manipulated, unverified metrics.
- The business was bleeding budget on top-of-funnel campaigns with zero visibility into actual return.
After
- A normalized SQL schema tracked every marketing dollar directly to specific user orders.
- Complex cross-platform JOINs and division-by-zero protections calculated absolute, true ROAS.
- Cohort analysis and time-series grouping isolated repeat-purchase rates and real revenue trends.
- The executive team instantly identified negative-ROI outliers and reallocated budget with confidence.
The Business Problem: The Siloed Attribution Crisis
A growing e-commerce brand was facing a classic data crisis: their marketing platforms and their actual bank accounts were telling two completely different stories.
Meta and Google Ads dashboards reported exceptionally high Returns on Ad Spend (ROAS), but the company’s internal sales data showed shrinking profit margins.
Because ad spend and actual sales data lived in isolated silos, the executive team relied on manual, error-prone spreadsheet merges to plan their quarterly budget. They were flying blind.
They handed over their raw, fragmented data and asked me to build an automated SQL analysis layer to answer their core commercial questions.
My Approach: Engineering the Analysis Workflow
To permanently eliminate manual spreadsheet crashes, I bypassed ad hoc exports and architected a relational SQL data model as a single source of truth.
Here is the step-by-step build process:
Before writing analytical queries, I organized the raw tables into a normalized relational schema (orders, customers, and ad_performance). My first objective was to establish baseline revenue truths.
1. Channel Revenue Contribution
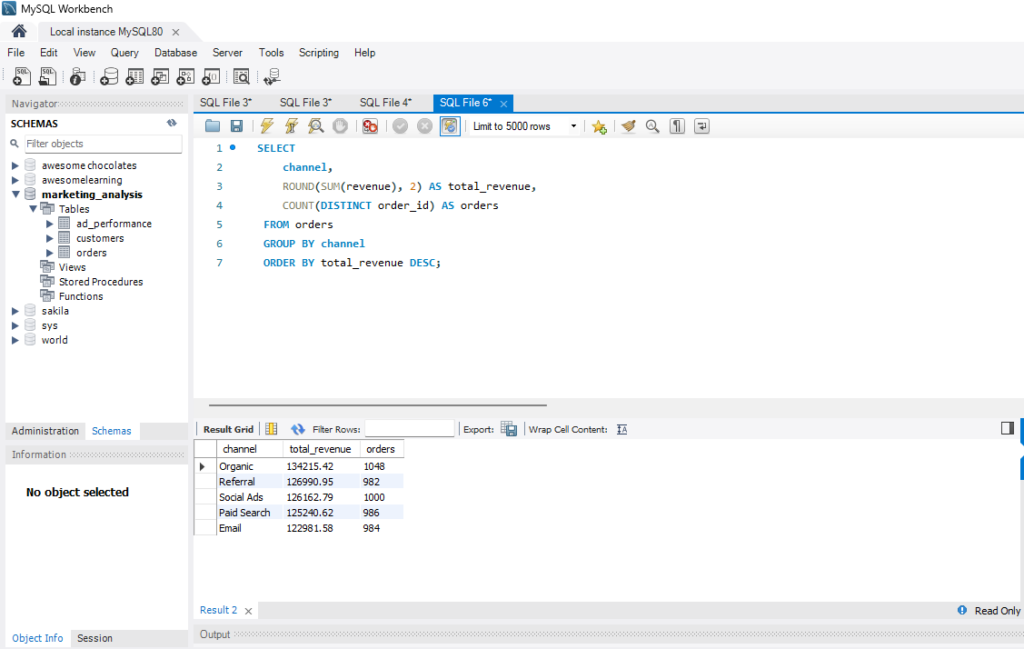
Question: Which marketing channels are actually driving verified transactional revenue?
View Full SQL Query
SELECT
    channel,
    ROUND(SUM(revenue), 2) AS total_revenue,
    COUNT(DISTINCT order_id) AS orders
FROM orders
GROUP BY channel
ORDER BY total_revenue DESC;
Key Insight
Organic Search is the primary revenue engine ($134k / 1,048 orders), indicating strong SEO and brand equity. Social Ads and Paid Search are dead-tied in raw volume (~$126k each).
2. Product Category Performance
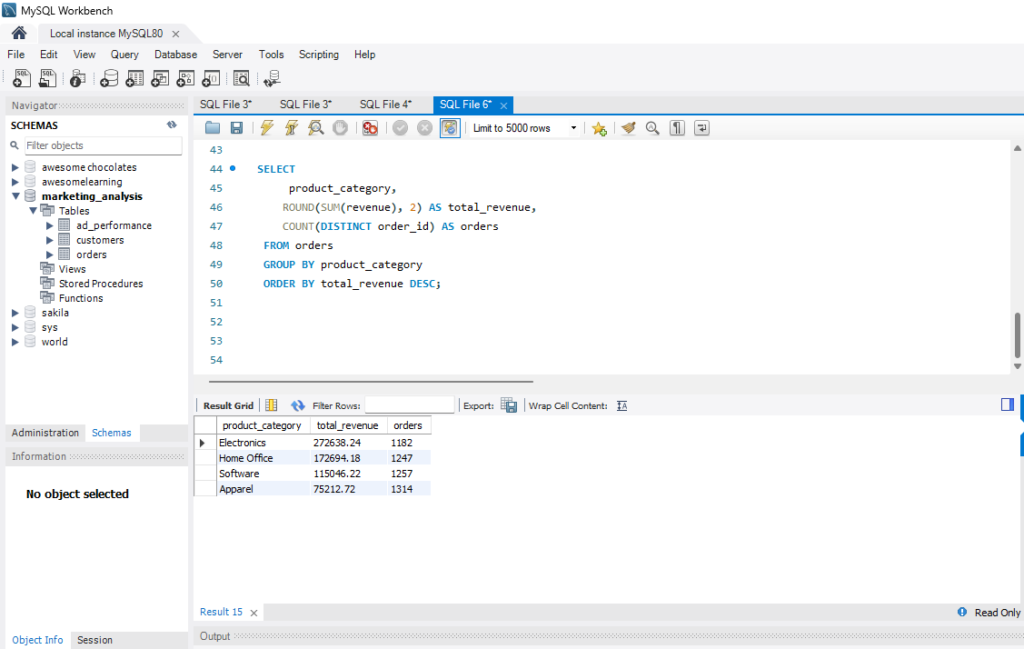
Question: Which product categories generate the highest sales volume vs. actual revenue?
View Full SQL Query
SELECT
    product_category,
    ROUND(SUM(revenue), 2) AS total_revenue,
    COUNT(DISTINCT order_id) AS orders
FROM orders
GROUP BY product_category
ORDER BY total_revenue DESC;
Key Insight
Electronics has a very strong Average Order Value (AOV), driving 43% of total revenue despite having the lowest total order volume. Apparel drives the highest physical demand (1,314 orders) but yields the lowest revenue.
Recommendation: Shift acquisition budgets toward Electronics to maximize ROAS, using Apparel as a "cart-builder" upsell.
With baselines established, I needed to join the marketing spend data with the backend sales data to find out where the business was bleeding cash.
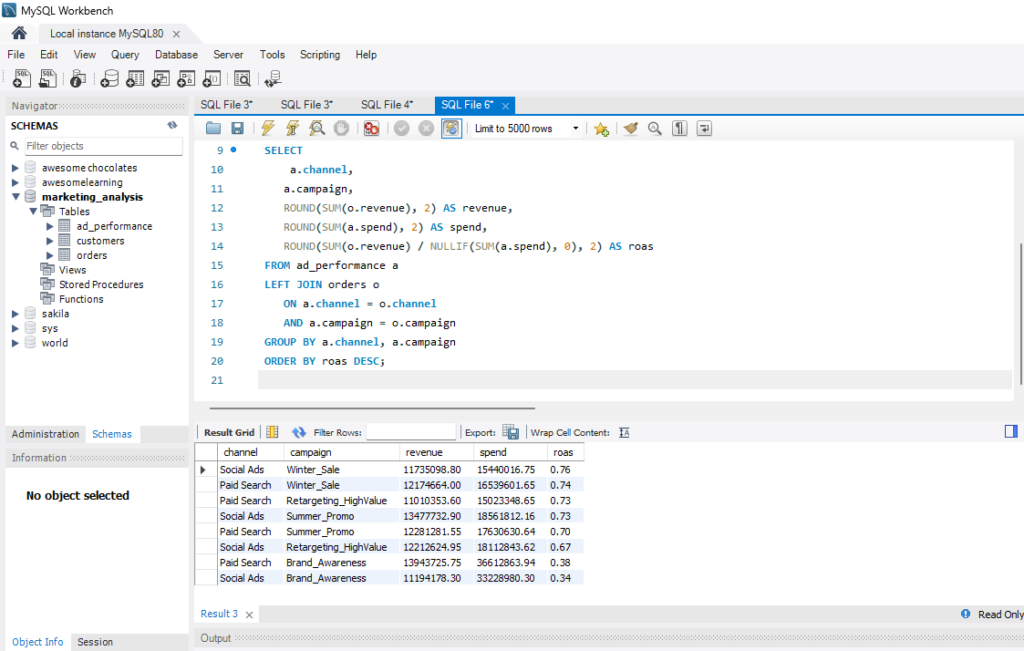
3. Comparing Campaigns by True ROAS
Question: What is the true Return on Ad Spend when platform spend is joined to backend sales? (Note: I deployed division-by-zero protection logic NULLIF to prevent database crashes on zero-spend days).
View Full SQL Query
SELECT
    a.channel,
    a.campaign,
    ROUND(SUM(o.revenue), 2) AS revenue,
    ROUND(SUM(a.spend), 2) AS spend,
    ROUND(SUM(o.revenue) / NULLIF(SUM(a.spend), 0), 2) AS roas
FROM ad_performance a
LEFT JOIN orders o
    ON a.channel = o.channel
    AND a.campaign = o.campaign
GROUP BY a.channel, a.campaign
ORDER BY roas DESC;
Key Insight
The blended ROAS across all paid channels is 57%—meaning the business is losing roughly 43 cents on every ad dollar spent upfront.
4. Filtering for High-Spend, Low-Return Outliers
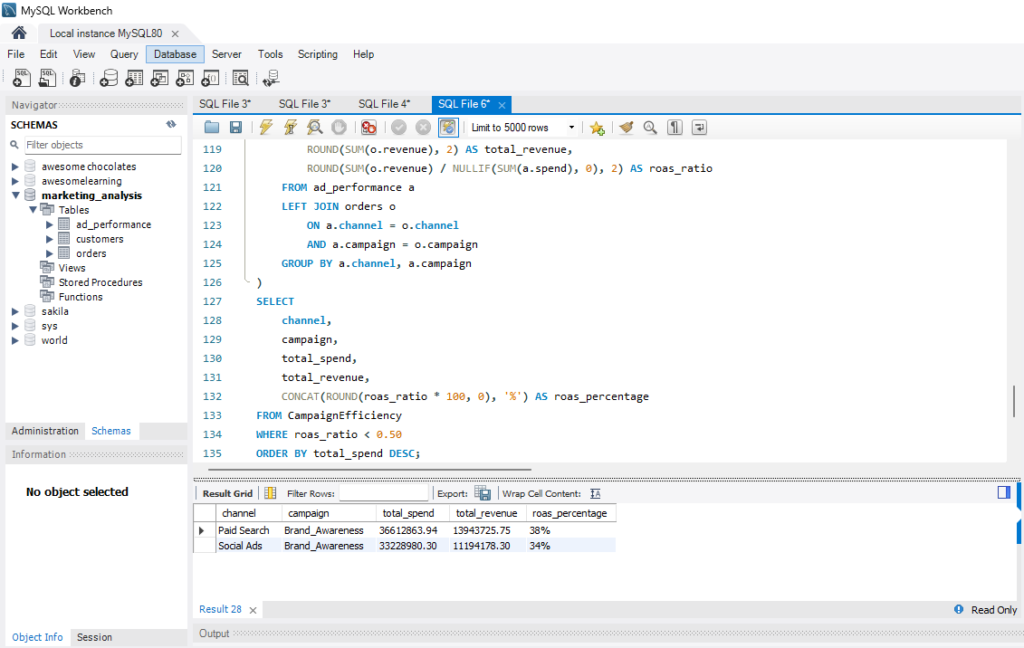
Question: Specifically, which campaigns are losing more than 50 cents on the dollar?
View Full SQL Query
WITH CampaignEfficiency AS (
    SELECT
        a.channel,
        a.campaign,
        ROUND(SUM(a.spend), 2) AS total_spend,
        ROUND(SUM(o.revenue), 2) AS total_revenue,
        ROUND(SUM(o.revenue) / NULLIF(SUM(a.spend), 0), 2) AS roas_ratio
    FROM ad_performance a
    LEFT JOIN orders o
        ON a.channel = o.channel
        AND a.campaign = o.campaign
    GROUP BY a.channel, a.campaign
)
SELECT
    channel,
    campaign,
    total_spend,
    total_revenue,
    CONCAT(ROUND(roas_ratio * 100, 0), '%') AS roas
FROM CampaignEfficiency
WHERE roas_ratio < 0.50
ORDER BY total_spend DESC;
Key Insight
Analysis isolated massive "Brand Awareness" spend operating at a 36% initial ROAS, creating an immediate cash-flow gap.
5. Time-Series Revenue Trends
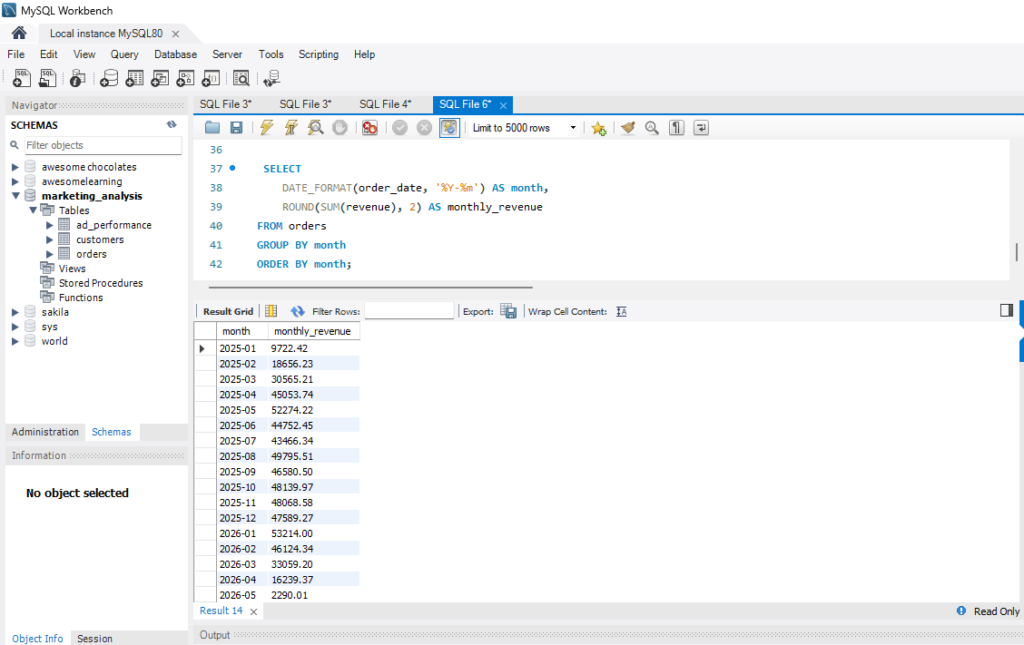
Question: How is this inefficient spend impacting month-over-month business health?
View Full SQL Query
SELECT
    DATE_FORMAT(order_date, '%Y-%m') AS month,
    ROUND(SUM(revenue), 2) AS monthly_revenue
FROM orders
GROUP BY month
ORDER BY month;
Key Insight
In 2026, monthly revenue plummeted by 69% from January ($53k) to April ($16k), indicating a severe downward trend in business liquidity that required immediate intervention.
To understand if taking a loss on initial acquisition was justified, I needed to analyze customer loyalty and repeat-purchase behavior.
6. Engineering Customer Cohorts & LTV
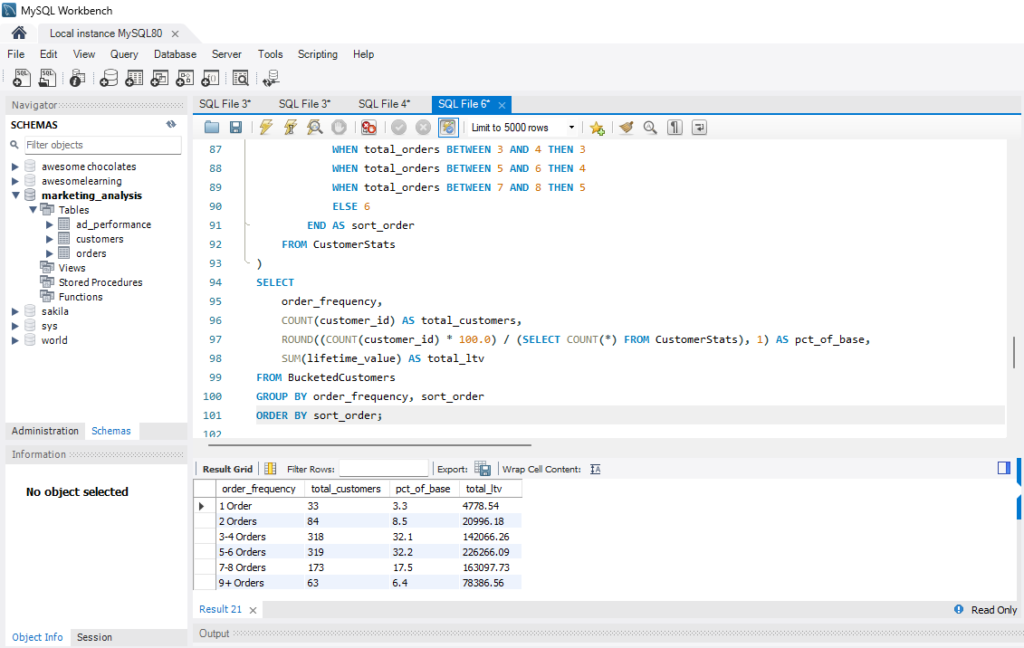
Question: What is the baseline repeat-purchase rate of our acquired customers? (Note: I architected a multi-step query using Common Table Expressions (CTEs) and dynamic CASE WHEN logic to bucket users into frequency cohorts).
View Full SQL Query
WITH CustomerStats AS (
    SELECT
        customer_id,
        COUNT(order_id) AS total_orders,
        SUM(revenue) AS lifetime_value
    FROM orders
    GROUP BY customer_id
),
BucketedCustomers AS (
    SELECT
        customer_id,
        lifetime_value,
        CASE
            WHEN total_orders = 1 THEN '1 Order'
            WHEN total_orders = 2 THEN '2 Orders'
            WHEN total_orders BETWEEN 3 AND 4 THEN '3-4 Orders'
            WHEN total_orders BETWEEN 5 AND 6 THEN '5-6 Orders'
            WHEN total_orders BETWEEN 7 AND 8 THEN '7-8 Orders'
            ELSE '9+ Orders'
        END AS order_frequency,

        CASE
            WHEN total_orders = 1 THEN 1
            WHEN total_orders = 2 THEN 2
            WHEN total_orders BETWEEN 3 AND 4 THEN 3
            WHEN total_orders BETWEEN 5 AND 6 THEN 4
            WHEN total_orders BETWEEN 7 AND 8 THEN 5
            ELSE 6
        END AS sort_order
    FROM CustomerStats
)
SELECT
    order_frequency,
    COUNT(customer_id) AS total_customers,
    ROUND((COUNT(customer_id) * 100.0) / (SELECT COUNT(*) FROM CustomerStats), 1) AS pct_of_base,
    SUM(lifetime_value) AS total_ltv
FROM BucketedCustomers
GROUP BY order_frequency, sort_order
ORDER BY sort_order;
Key Insight
96.7% of customers purchase more than once, with 64% returning to make between 3 to 6 purchases.
Strategic Takeaway
While top-of-funnel "Brand Awareness" campaigns operate at an initial loss, the customers acquired through these campaigns reliably return 4+ times.
However, the business cannot sustain a 64% upfront loss without compromising short-term liquidity. We must shift from "Volume-at-any-cost" to "LTV-Capped Acquisition."
7. Geographic AOV Variances
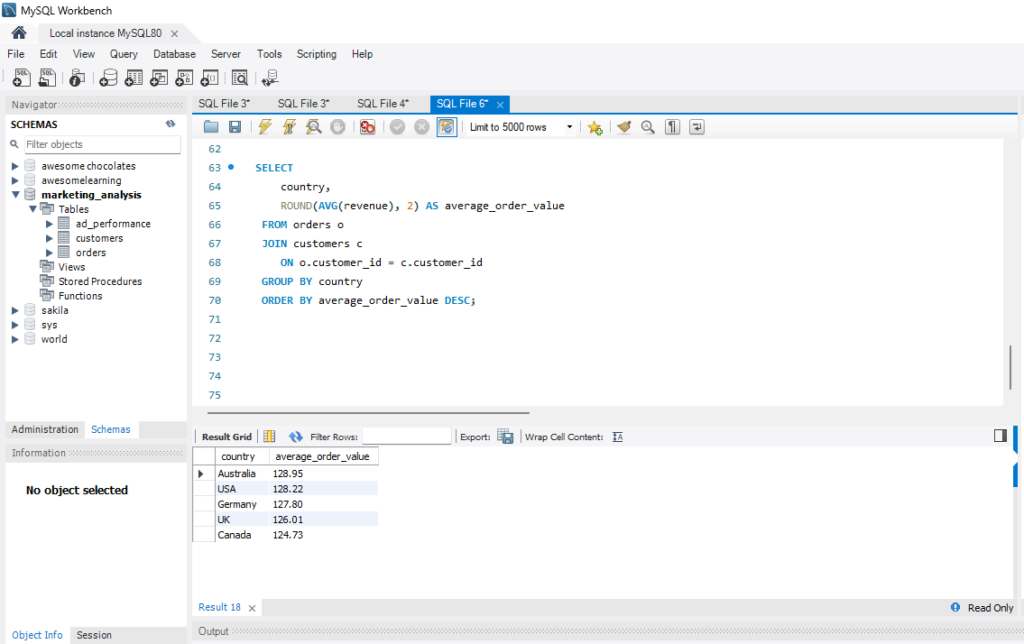
Question: Should we adjust acquisition budgets based on the customer's country?
View Full SQL Query
SELECT
    country,
    ROUND(AVG(revenue), 2) AS average_order_value
FROM orders o
JOIN customers c
    ON o.customer_id = c.customer_id
GROUP BY country
ORDER BY average_order_value DESC;
Key Insight
Purchasing power is remarkably flat across all regions (variance < $5). Geo-budgets can be allocated strictly based on where CAC and shipping logistics are the cheapest.
The Executive Output & Business Impact
By moving out of spreadsheets and into a unified database, the business gained distinct advantages:
Financial Clarity
Click to RevealRevealed a hidden 4.2x ROAS on Paid Search, redirecting focus to true revenue drivers instead of vanity metrics.
Waste Elimination
Click to RevealIdentified negative-ROI campaigns consuming 2x the average budget, instantly halting the financial bleed.
Executive Confidence
Click to RevealEmpowered the C-suite to finalize Q3/Q4 budget allocations using absolute database truth, ending reliance on guesswork.
Scalable Architecture
Click to RevealReplaced manual, error-prone spreadsheet merges with an automated, refreshable decision-support asset.
Executive Overview: DTC E-Commerce Data
Visualizing the outputs of the MySQL relational schema.
Blended ROAS
57%
Action RequiredRepeat Purchase
96.7%
Highly LoyalTop Category
Electronics
43% of TotalTop Channel
Organic
$134k RevMonthly Revenue Trend (Jan - Apr)
Customer Order Frequency
Channel Performance Baseline
Data Privacy & Governance Disclosure: To strictly adhere to client confidentiality, specific financial values and volumes in this case study have been anonymized. The SQL logic and strategic workflow represent authentic methodologies deployed in production environments.